
Manual Recording
To start manual recording, go to a required task page and click the Record action. Set the desired record duration and press the Manual recording button. Now, as the recording is started, you can see the recording progress in the list below. You may abort the process by clicking the stop action. Once the recording is finished, you may download the record archive in the required format, just click the corresponding icon in the Actions column.
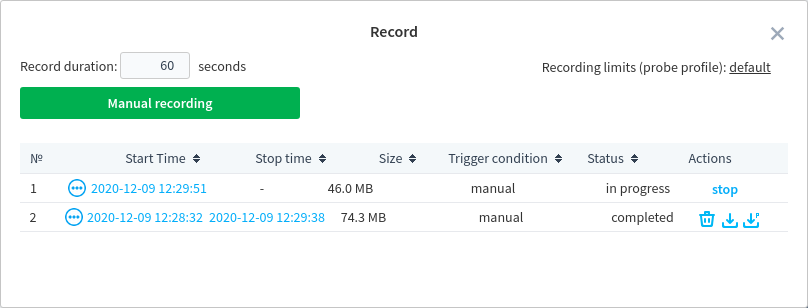
The Record window also displays the following information: recording start and stop time, record size and its status, trigger condition.
The Status column may display the following record states:
in progress — the stream is currently being recorded;
completed — the probe has completed recording;
- aborted — the probe failed to complete recording. The following error codes are possible:
100 — an unknown reason;
101 — the task has been stopped;
102 — insufficient disk space;
103 — recording is prohibited for this source type;
104 — the task crashed, the recording was stopped;
105 — the probe crashed, the recording was stopped;
110 - 119 — the server initiates recording stopping.
blocked — the record is currently downloaded and cannot be deleted.
The Actions column contains three tools to manage records:
 — download a Pcap record (only for IPTV streaming; UDP/RTP protocols);
 — download a conventional record (its type depends on a stream protocol);
 — delete a record.
Some system limitations affect the recording process. To set the limits, click the probe profile name in the top right corner. The pre-buffering and recording duration settings are not applied to manual recording.
Pcap Recording
The Pcap recording provides the opportunity to analyse the IPTV streams delivery. In case the probe fails to analyse a stream, Pcap recording will capture an exact copy of network traffic for subsequent analysis. The probe captures network packets data and records it to a file in real time. Pcap data is recorded both in automatic and manual recording modes. Once the recording is finished, you may download the record file. The record file includes a detailed description of a triggered event (in the JSON format) and a Pcap dump file which contains all network protocol headers used for a stream delivery as well as timestamps of captured data. You may open Pcap files in Wireshark or similar software designed for monitoring and analysing the network traffic which compatible with libpcap format.
When starting to work with Pcap records, you need to know the following important things:
Pcap recording is supported for IPTV streams only (UDP/RTP protocols);
Pcap records downloading is disabled by default due to security reasons (the probe may create Pcap records, but they cannot be downloaded from the browser). To allow records downloading, stop the probe or the service and open the probe configuration file, then set
truevalue for the"allowDownloadPcapDump"parameter. Save changes and start the probe;You need to run the probe with advanced privileges. For Windows: install the NPcap library and run the probe with administrator rights. For Linux, the probe should be started with root privileges
sudo ./streamMonitorcommand.
To download Pcap data, use the action.