7.1. Dataminer
7.1.1. Introduction
Boro Solution supports integration with the Dataminer network control platform. The interaction between two solutions relies on a connector (protocol) that is developed specifically for Dataminer software. The protocol comes as an xml file available for download from the official catalog.
7.1.2. Configuration of the Protocol
The protocol must be uploaded to DataMinerCube. To do this, go to Apps → Protocol & Templates, click the Upload… button in the lower right corner of the screen, then select and upload the protocol.
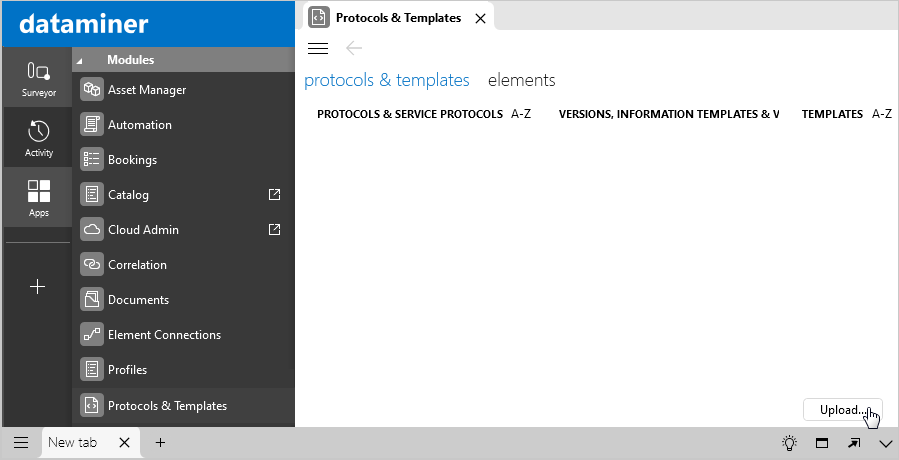
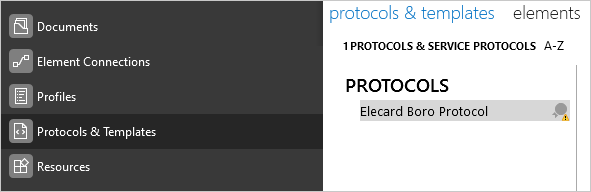
The uploaded protocol will be displayed in the Protocols field.
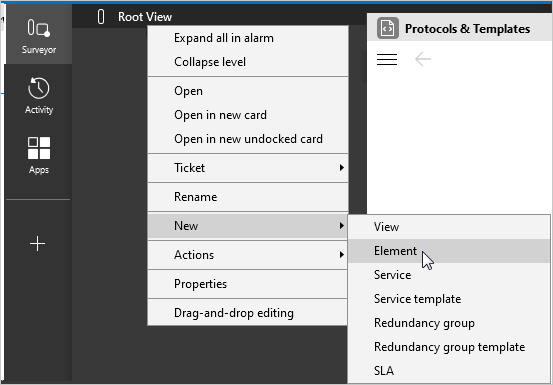
Click the Surveyor icon on the panel to the left. Then right-click Root View and select New → Element to create a new element.
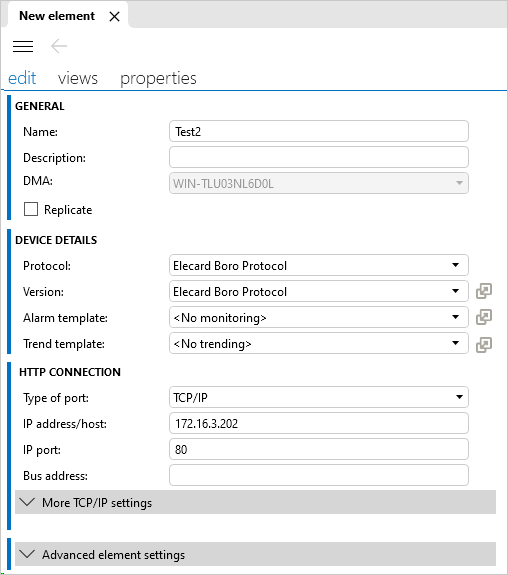
Further, in the settings window specify the element name, select the protocol (Elecard Boro Protocol as specified in the picture), provide an IP address/host and an IP port.
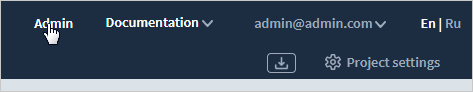
For the protocol operation, you need to get a User ID and enable Control API in the Boro web interface. To find out the User ID, open the interface and go to the Admin tab.
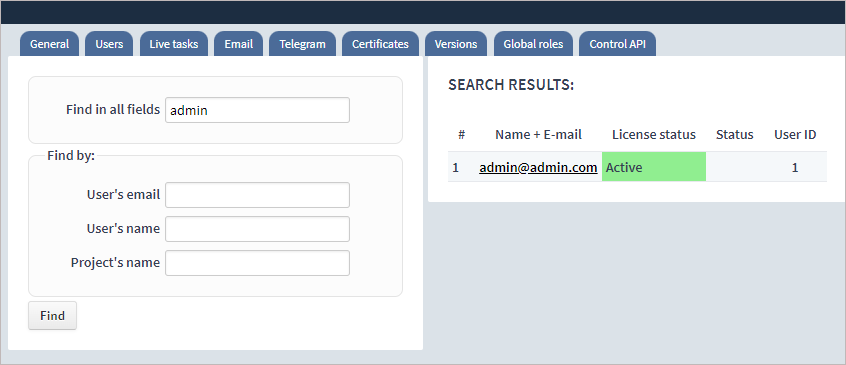
Next, in the Users tab, find the required user in the All registered users table and write or memorize the User ID. You can also find the user by means of the find section in the left part of the page.
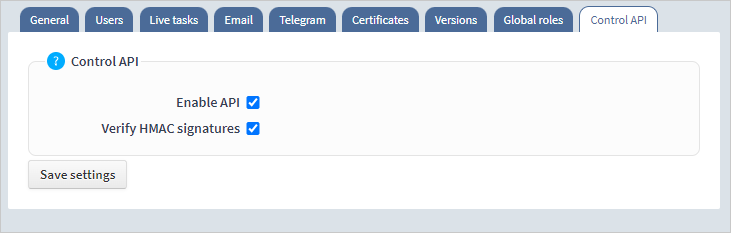
To enable Control API, do the following:
Configure access to API in the Nginx server.
Go to the Control API tab, click Enable API and save the settings.
The enabling process is described in detail in the API General Information section.
Note
The host name must be specified in advance in the Host name field of the General tab. Otherwise, you will not be able to apply the API settings.
If a digital signature is required, you can enable the Verify HMAC signatures option, since the Dataminer protocol supports this functionality.
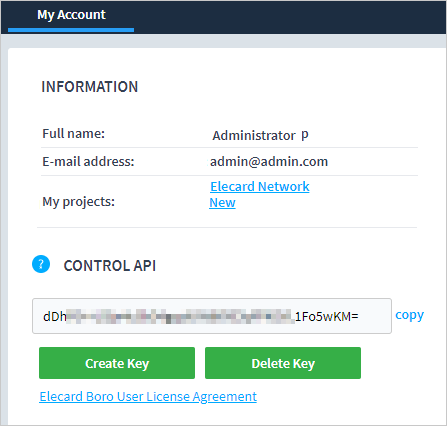
To use a digital signature, you need to create a key. This can be done by clicking the Account name → My account in the top right corner.
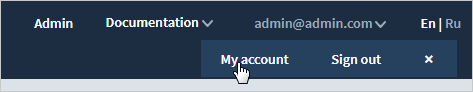
Then click the Create Key button and copy the generated token.
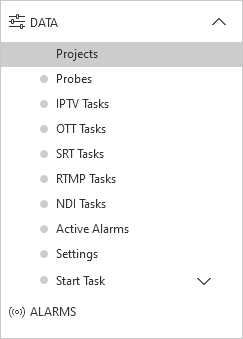
Go back to the protocol in the Dataminer app interface. The protocol has the following pages that are displayed to the left when clicking the created element:
Projects — display of projects;
Probes — display of probes;
[IPTV, OTT, SRT, RTMP, NDI] Tasks — display of tasks in accordance with their protocol;
Active Alarms — display of active and inactive alarms;
Settings — protocol settings;
Start Task — page with settings for launching tasks.
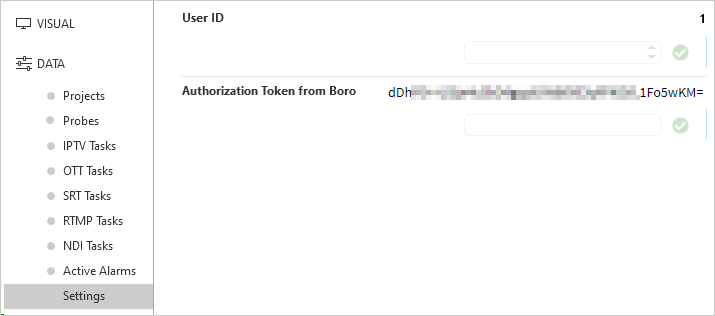
Go to the Settings page, specify the User ID and, if required, the token for using digital signature (the Control API setting should be enabled). When the User ID is specified, click the green checkmark and confirm changes. After saving, the entered value will be displayed in the field against the User ID. Repeat the operation for the authorization token.
7.1.3. The Projects Page
The page displays the project title, the project founder, the number of live probes and tasks, as well as the total number of licenses involved (live streams). The table header displays summary numbers across the entire table.
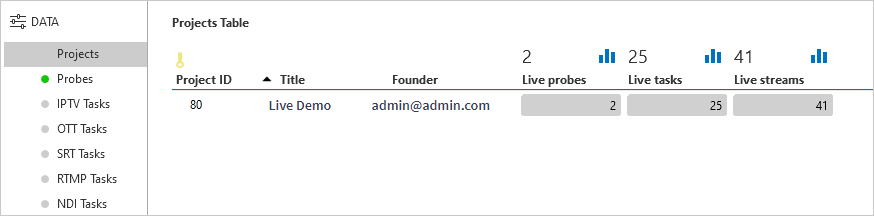
To remove obsolete data from the table, click the Refresh table button.
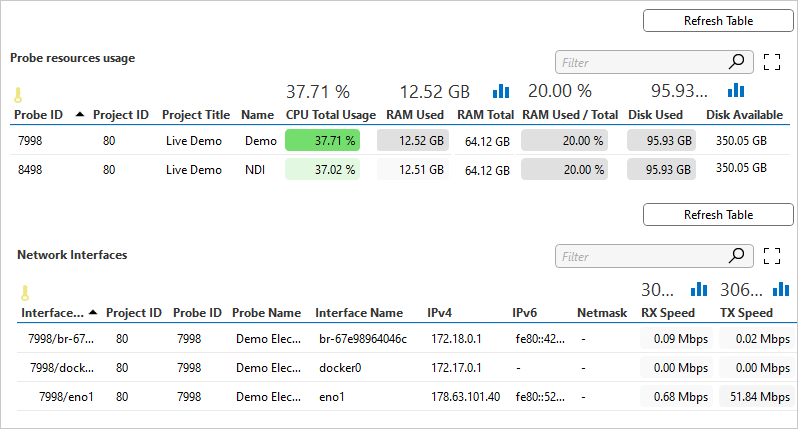
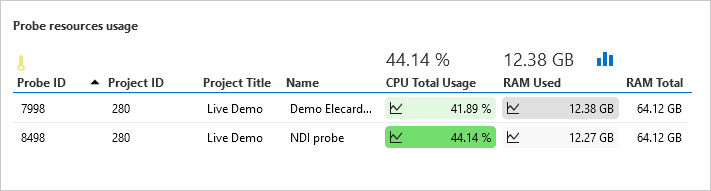
7.1.4. The Probes Page
The page displays the project title, the probe name, CPU Total Usage, RAM Used, RAM Total, the ratio of RAM Used to RAM Total in percentage, the amount of disk space used (Disk Used) and the available disk space (Disk Available). The maximum values for these parameters, except for the available disk space, are displayed in the header. The Network Interfaces table displays the probe name, the interface name, IPV4 and IPV6 addresses, the net mask, the speed of getting data and the speed of transmitting data (the header displays the maximum value).
7.1.5. The Task Pages
The page includes two tables: one with live tasks and the other with completed tasks. The table with completed tasks displays all tasks regardless of the protocol.
The tables contain the following information: the probe name, the task name, the probe, task, and project IDs, the task status (Started, Stopped, Stalled), the protocol (iptv, hls, dash, srt, rtmp, ndi), the URI, the task start time, the interface name, the streaming interface (iptv4), the Node Type that shows whether the task is independent (i.e., it does not contain SINGLE or ROOT subtasks) or the task contains subtasks (ROOT, CHILD). You can stop or resume tasks in the Action field. To hide certain columns, right-click the table header and select Columns. Uncheck those columns you want to hide.
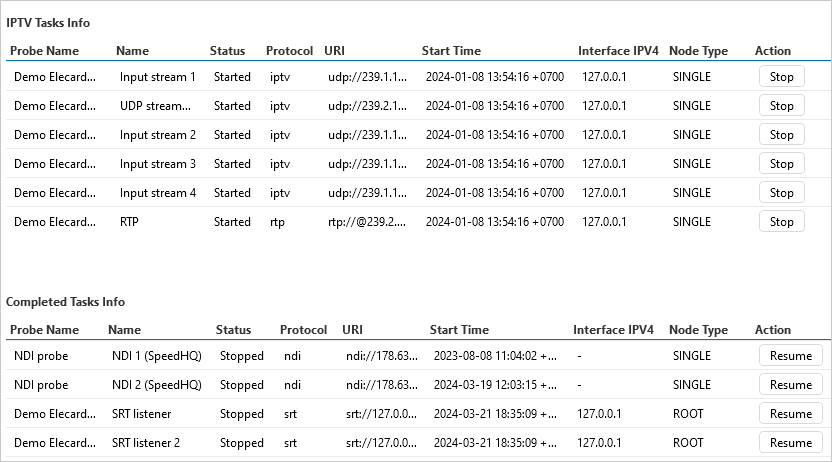
You can refresh each table. As a result, old fields will be replaced with new ones. You can stop any running task by clicking Stop and resume it with the Resume button.
Note
You cannot stop OTT and SRT subtasks, but only a parent task. Only parent or single tasks are added to the table with completed tasks.
When stopping or restarting a task, a window will appear where you need to confirm the command execution.
In case the request is successfully handled, you will see a window that confirms the request has been sent.
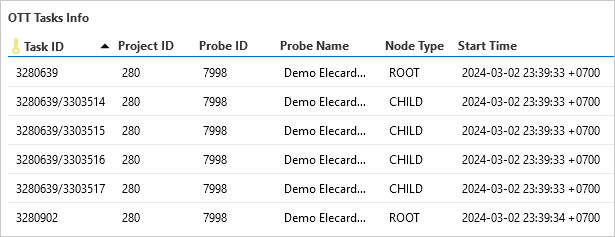
For convenience, OTT and SRT tasks are grouped like this:
The parent task comes first (e.g., the task with ID 3280639 and the ROOT Node Type);
The subtasks come next (e.g., tasks with IDs 3280639/3303514 and 3280639/3303515; the Node Type is CHILD).
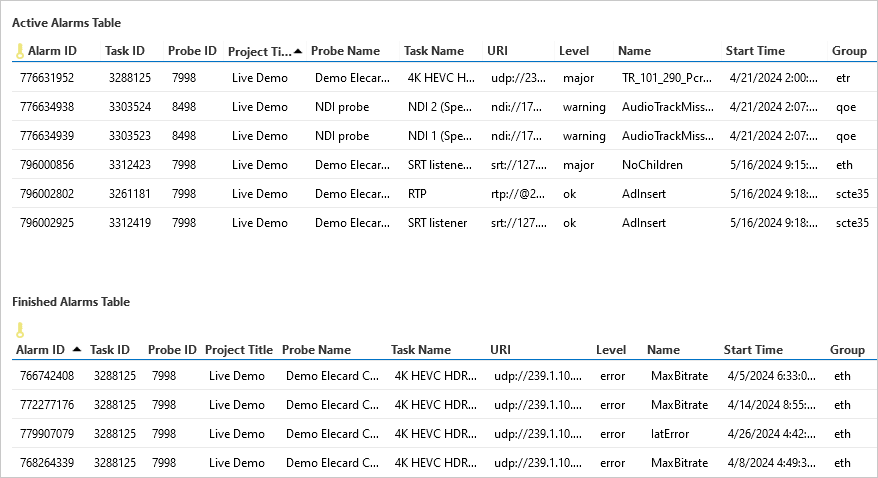
7.1.6. The Active Alarms Page
The page displays a table with active alarms and a table with finished alarms. Both tables contain the following fields: the project title, the probe name, the task name, the task URI, the alarm level (ok, error, warning major, fatal), the alarm name, the alarm start time, the alarm group (ETH — Ethernet, ETR — TR 101 290, QOE — Quality of Experience, OTT — OTT and Progressive Download, SYS — System and SCTE35). More information is available in section TaskAlarms.
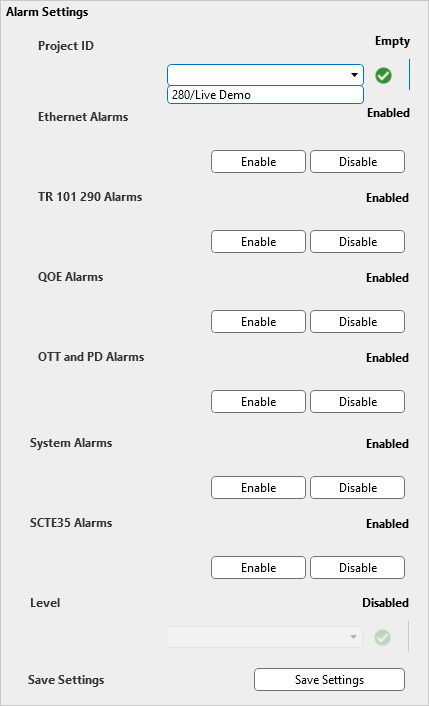
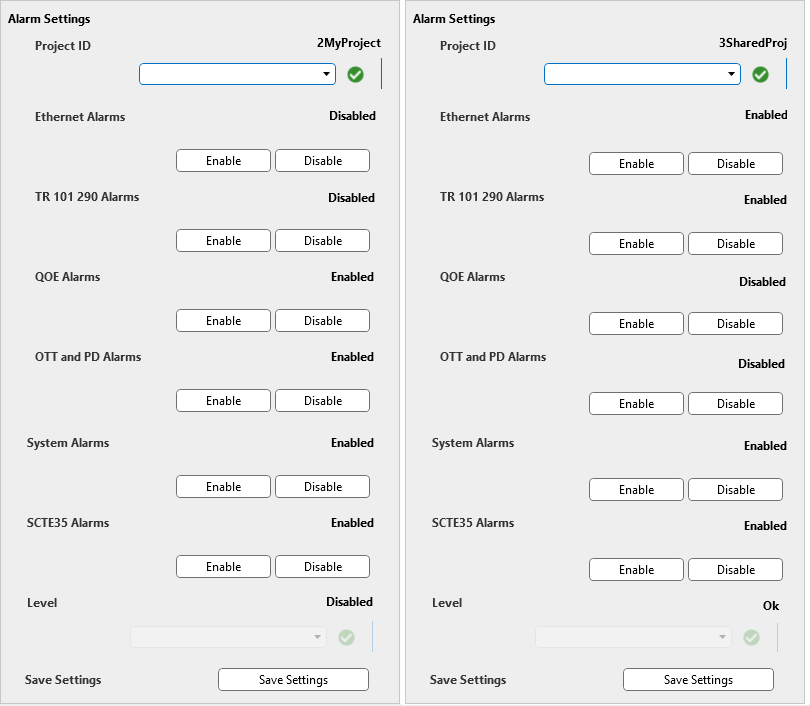
7.1.7. The Settings Page
The page lets you configure the way alarms are registered for each project individually. To do this, select the required project and click the green checkmark for confirmation. As a result, the project ID/name should display in the Project ID field. By default, all settings are enabled for all projects (except for the Level field). The Level field lets you select a certain level of alarms registered in the project, e.g. if you need to display only Major or Fatal level alarms.
Additionally, you need to remember that alarms are selected depending on the general settings configuration. For example, if you have only QOE and OTT fields enabled, and the Major level is set, then you will receive only QOE and OTT alarms of the Major level. Click the Save Settings button to save the settings.
Below are the examples of different settings for 2MyProject and 3SharedProj projects. When selecting a project, saved settings will be automatically displayed on the screen.
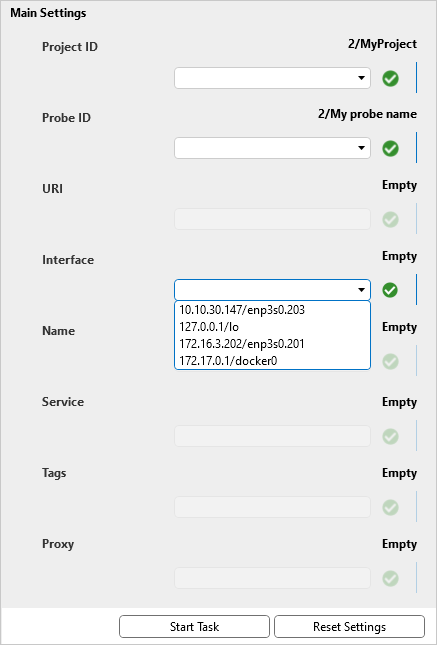
7.1.8. The Start Task Page
The Start Task page is designed for task creation. The process of creating a task is almost identical to adding a task in the Boro Solution web interface. To create a task, fill in the appropriate fields.
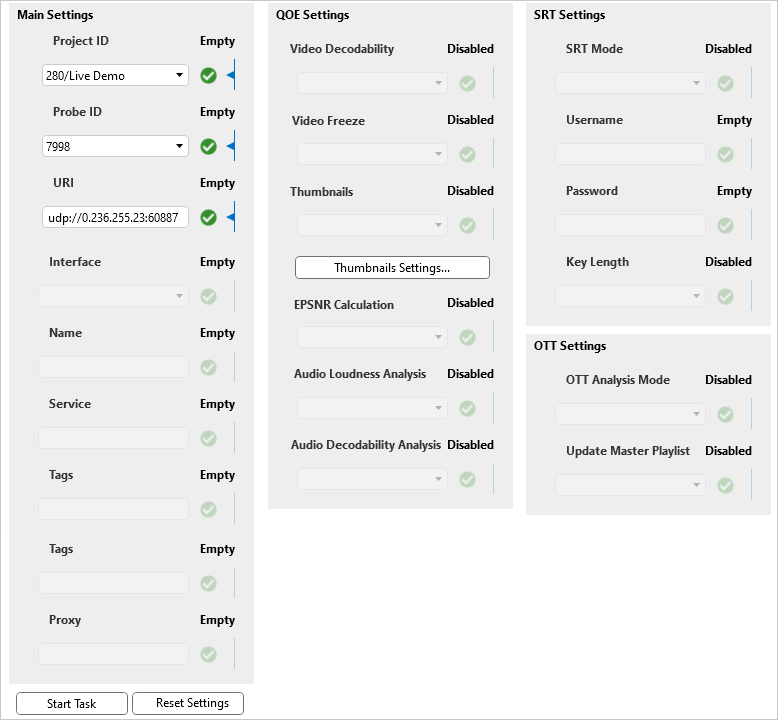
Note
The User ID, Project ID, Probe ID and URI fields are required for task creation.
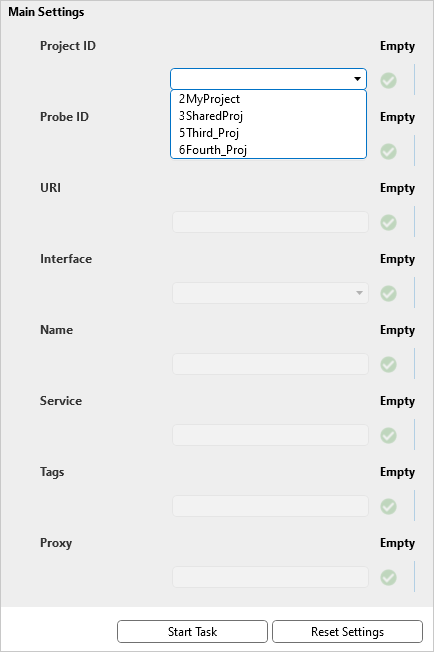
The selection of Project ID, Probe ID and Interface occurs in the following sequence: Project ID → Probe ID → Interface (when selecting, click on the green checkmark in the corresponding field to confirm). The Project ID is taken from the projects table.
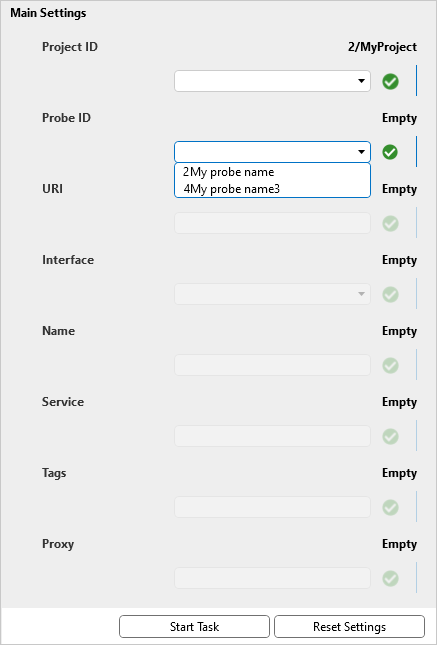
The Probe ID field is selected by the protocol, depending on the previously selected project. Thus, only probes belonging to the project with ID 2 are available.
Next, an interface is selected. Interfaces are selected by the protocol, depending on the previously selected probe. Some settings can be selected from the list, while others should be manually specified. When saving, you need to click the green checkmark to confirm changes.
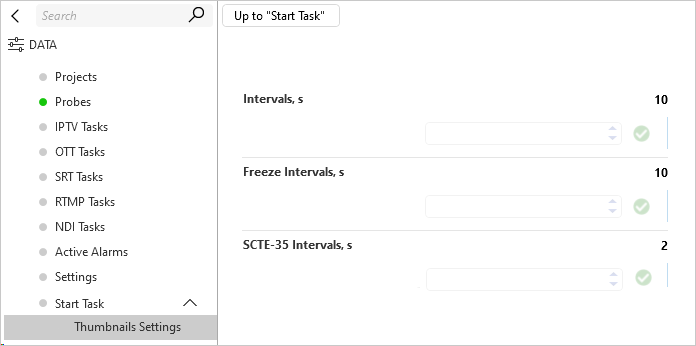
In the Thumbnail Settings tab, you can set up the intervals for capturing thumbnails, as well as the frequency of capturing during video freeze and during ad insertion.
After all settings are made, click the Start Task button to run the task.
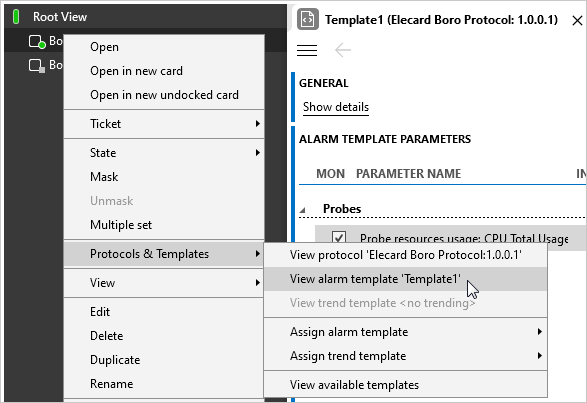
7.1.9. Alarms and Trends
Alarms and their level can be set in Dataminer by right-clicking the desired element and selecting View alarm template. Before that, you need to create a template via the Assign alarm template menu.
Then, you need to choose the Only protocol parameters option, select the desired parameters, set their level, and enable them.
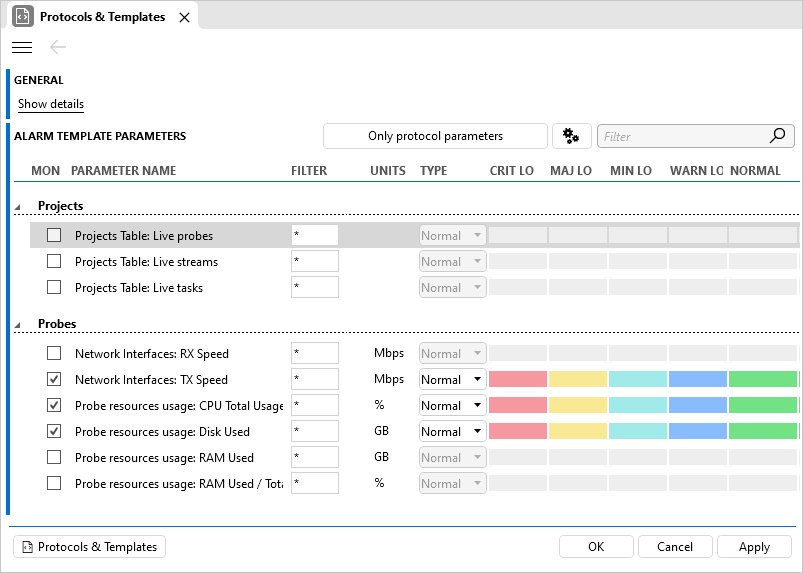
You can also select tracked parameters for a trend.
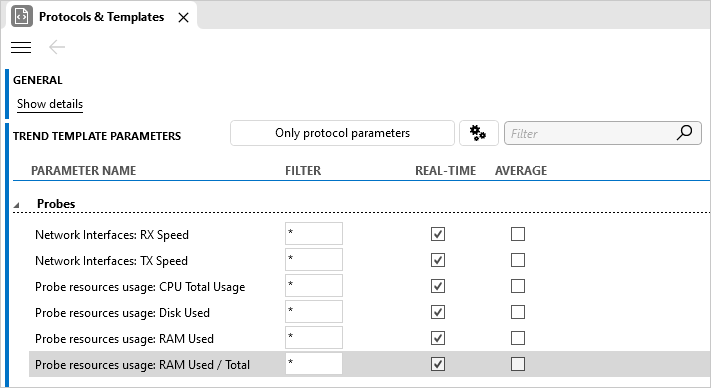
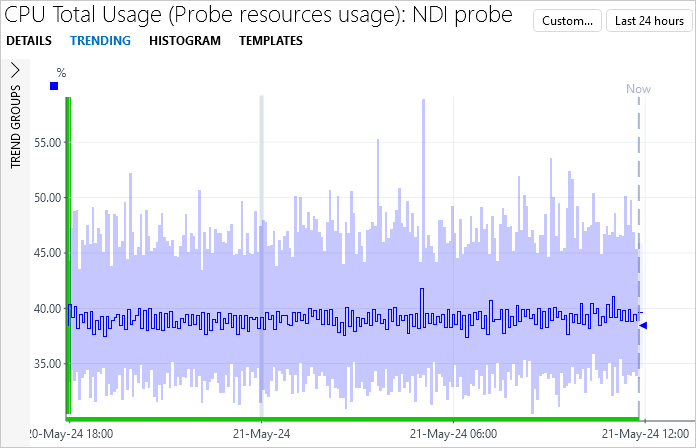
After selecting and saving the parameters, a trend icon should display next to the corresponding parameters.
By clicking on the icon, you can see the trend of the monitored parameter.