
IPTV Scan
Overview
The probe can scan network interfaces to check for traffic or stream announcements over the SAP (Session Announcement Protocol). An interface scan is available to capture any streams based on the UDP or RTP session. Captured streams can be added as common tasks or run in the Sniff mode. To successfully start a detected stream as a common task, it should be an MPEG-TS transmitted over the UDP/RTP. In the Sniff mode, the probe captures a limited number of parameters (bitrate, no signal, source IP and MAC addresses, IAT and other Ethernet parameters). If the probe detects an MPEG-TS in a stream, it will start the full-featured stream analysis without leaving the sniffing process.
Below are the possible use cases of the Sniff mode:
Analysis of unicast not destined for the machine on which the probe is running;
Analysis of unicast destined for the machine on which the probe is running so that the reception of this data by another program is not disrupted;
Analysis of multicast without interfering with the network (mainly without sending IGMP packets to the network);
If, for some reason, you do not want to change the network subsystem settings in the operating system where the probe is running. For example, when in order to receive packets via a system socket you have to: disable firewall or rp_filter, add VLAN interfaces or change the routing table.
Use
To open a scan window, click the IPTV Scan button.
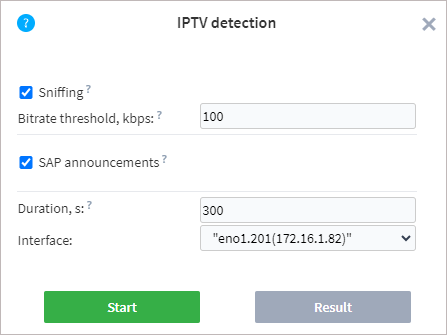
The Sniffing option allows you to capture the packets coming into a specific interface. The following is required for the successful capture:
Organize receiving packets to a specific interface. Please ensure that your host is destination for multicast or unicast data. Otherwise, configure the router for traffic mirroring (SPAN) to a sniffed port;
Allow probe access to the packet capture library.
Windows: install the Npcap capture library on the computer where the probe is launched. When installing the library, select the WinPcap API-compatible Mode and Support Loopback Traffic options;
Linux: launch the probe with the superuser privileges:
sudo ./streamMonitor.
The Bitrate Threshold setting indicates the minimum bitrate of the stream during sniffing. If the bitrate exceeds the set threshold value, the stream is added to the candidate list.
If the SAP announcements option is enabled, then the probe will also check for the presence of session announcements.
The probe detects announcements on the following addresses: 224.2.127.255, 239.16.33.255, 224.0.0.255:9875, 239.255.255.255:9875, 239.195.255.255:9875, 224.2.127.254:9875.
When scanning announcements, there is the opportunity to obtain a stream name that will be used as a task name.
To start a scan, select or specify the following parameters:
Duration — duration of scanning for the selected interfaces. The maximum duration is 900 seconds.
Interface — one or more physical or virtual interfaces that the probe has detected in the operating system.
Once the parameters are set, click the Run button. A scan starts immediately, and the results window opens.
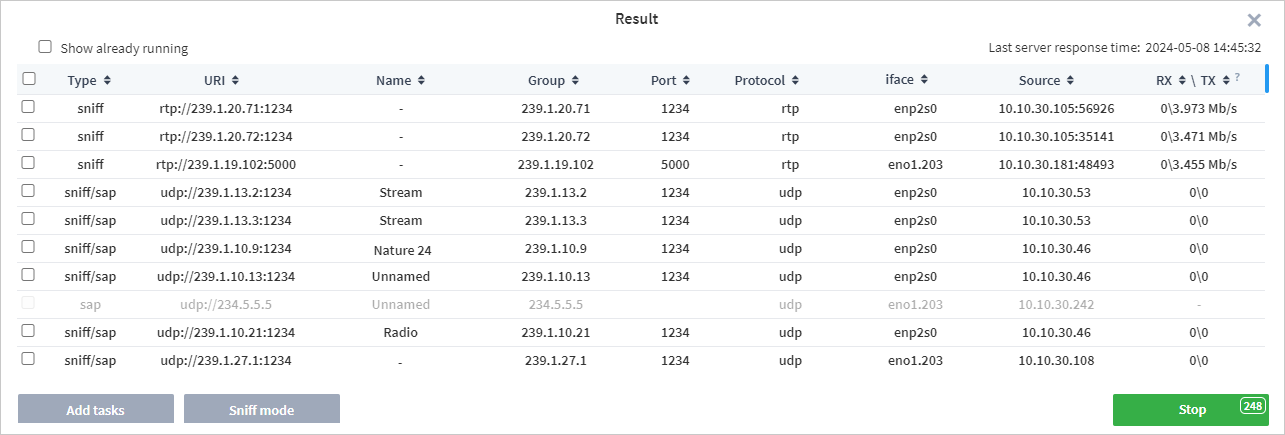
The list will be updated with candidates in real time. The right side of the window shows the time of the last response from the server, allowing you to monitor both the scanning process and the relevance of the data. The table contains the following fields:
Type — scanning method (sap, sniff or sap/sniff). The latter option is specified if there are sap and sniff candidates with similar addresses.
URI — address of a detected stream.
Name — a channel name (if present).
Group — multicast group IP address.
Port — port number used for broadcasting.
Protocol — protocol type. UDP or RTP can be specified.
Interface — the name or address of the interface on which the stream was detected.
Source — broadcast source address.
RXTX — receiving speed and transmitting speed. RX/TX field values are measured relative to the signal Source, not to the network card of the machine on which the probe is running.
You can expand the scan results table to increase the number of streams displayed simultaneously.
If the probe detects streams already being analysed by the probe, they are highlighted in yellow. To exclude such streams, clear the Show already running checkbox. When the desired candidate is found, you can stop the search by clicking the Stop button (this process may take several seconds). The Stop button displays a countdown timer until the scanning process automatically completes.
After scanning is completed, detected streams can be added as new analysis tasks or run in the Sniff mode.
To run analysis tasks, select one or more tasks and click the Add tasks button. You cannot select streams that are grayed out because these streams do not have enough data to perform analysis. In the adding task window, specify the required settings and start the analysis. If you select several streams with different interfaces, each task will have its own interface applied. The process of creating tasks is described in detail in the section Adding New Tasks.
If required, detected streams can be run in the Sniff mode. After running the task in Sniff mode, the Probe will attempt to identify the type of data in the stream. If a MPEG-TS stream is detected, the download speed and PID bitrate graphs are displayed on a task page.
Warning
A task started over SAP in the Sniff mode will result in Bad Source (No signal) if IGMP snooping is working on the network, because the probe doesn’t subscribe to a multicast in the Sniff mode.