
Managing Probe
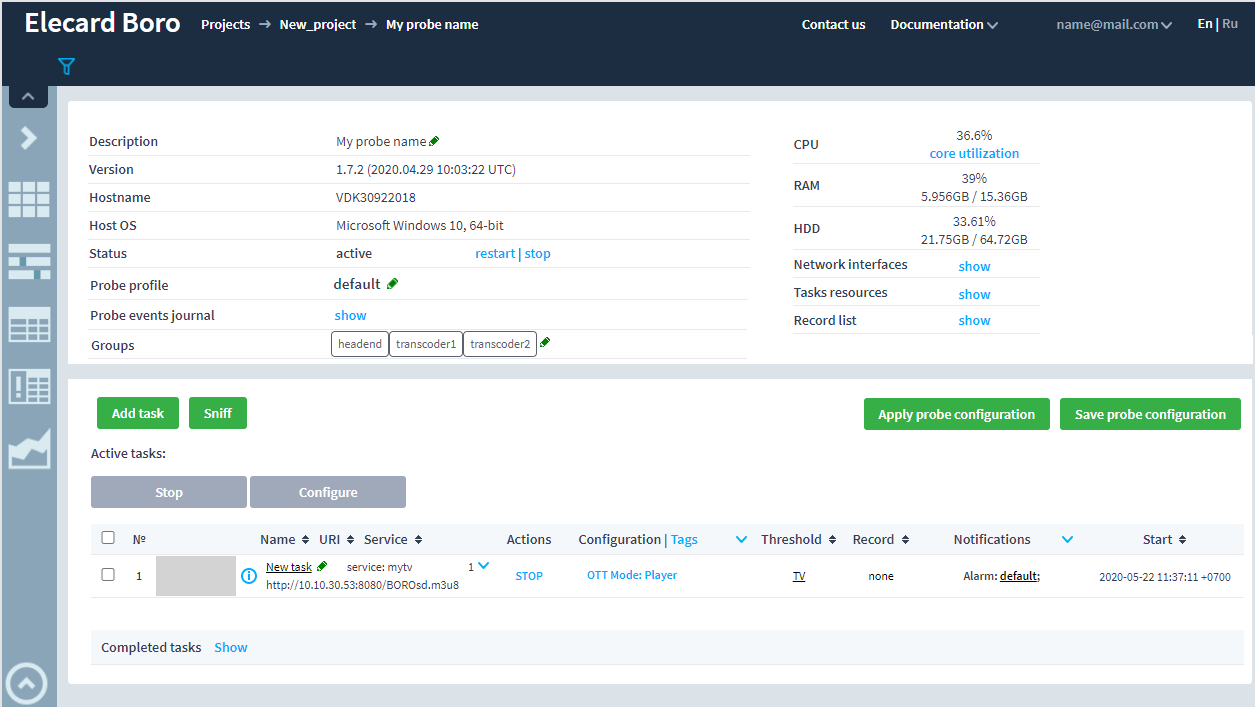
The probe page is the main tool that allows you to control the probe and tasks. After the probe is started, the page will update and display the main information about the probe, system utilization data, and tools for managing tasks.
Controlling and Updating
In the upper-left part of the page, the block presents information about the probe, such as the name, version, status, profile.
It also contains the name and operating system of the computer on which the probe is running.
To rename the probe, click the  icon, then click the Enter to save a new name.
If necessary, you may update the probe version by clicking the update button and selecting the available version from the list. The action is possible if there is a newer probe version on the server.
Important
All settings and tasks are saved during update. However, it is recommended to save probe configuration on the server manually before updating.
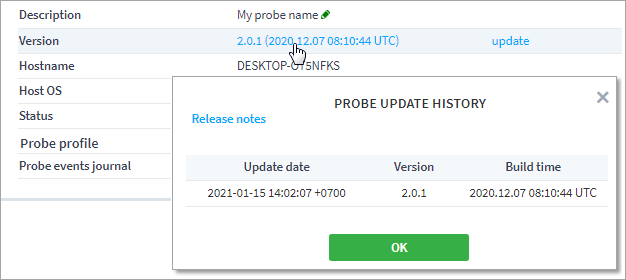
The probe should update within 1 minute, then the webpage will automatically refresh. If the webpage has not been updated automatically, press F5. When updating a probe with a version lower than 2.0.2, you may need to manually restart the probe on the remote computer. To view the update history, click the current probe version. To know more about features and fixes in the current version, click the Release Notes. In the next tab, the page will open. Go to the description of the required version using navigation panel. Sometimes it is necessary to upgrade a probe to an unofficial version, such updates are only available on the All Probes page.
To control the probe, use restart | stop buttons.
To change the probe system profile, click the icon in the Probe profile line and select the profile from the drop-down list.
You can create a new profile in the tab Project Settings ➝ Probe Profiles ➝ System.
The probe events journal contains stop/start/update history beginning from the probe creation and first start. To open the journal, click the show button.
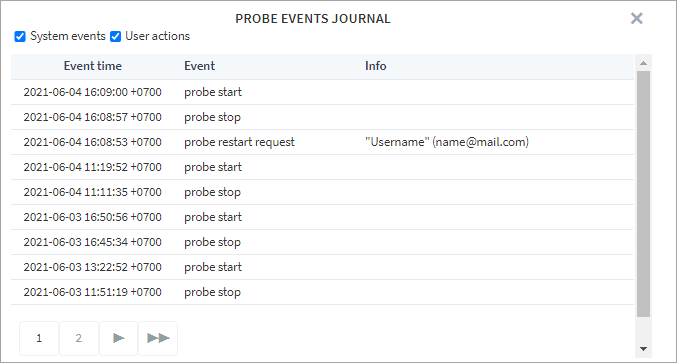
You can display the System events or User actions by selecting the appropriate filter button.
Groups are designed to connect multiple probes and(or) share access between users. To add new groups, click the pencil icon and fill in the names of groups separated by spaces. Then specify the same groups for other probes. The added probe groups can be used to filter data across all views.
Probe resources
In the upper-right part of the page, the system statistics is displayed: the real-time information about CPU, memory, disk, and network subsystem. This can help to prevent excessive use of system resources when adding tasks to the probe.
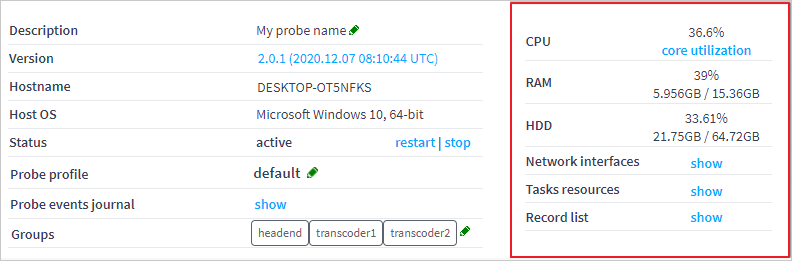
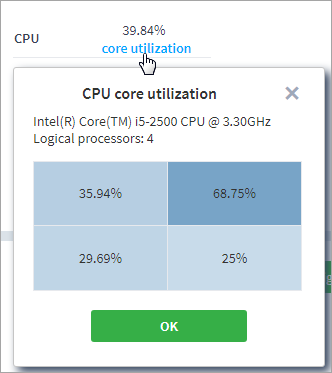
The CPU line displays the current utilization of all server CPUs by all system tasks. Use the core utilization action to view the graphic distribution of load between logic processors.
Below is the percentage of RAM utilization, along with used and total RAM amount.
When CPU and RAM usage reaches the high level, a warning indicator is displayed for the metrics. The color of the indicator depends on the level of resource consumption in accordance with the set thresholds and color.
When exceeding CPU/RAM Usage Warning Thresholds, the orange indicator is displayed. The default value is 70%.
When exceeding CPU/RAM Usage Error Threshold, the red indicator is displayed. The default value is 90%.
You can change threshold values in the Probe Profiles ➝ System.
The HDD line shows the used and total space of the hard disk partition containing the record folder. Note that the folder may be located separately from the probe, as specified in the Working with System ➝ Recording ➝ Adjusting System Profile. If the probe cannot find or create the record folder, the probe will display the size of the partition containing the probe folder.
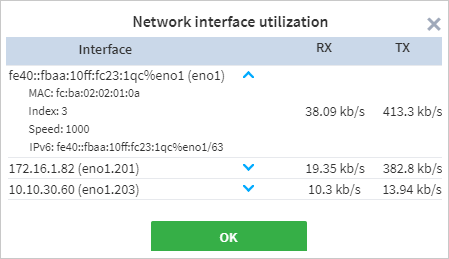
Use the show action in the Network Interfaces line, to view the system network interfaces and the receiving speed (RX)/transmitting speed (TX) for them. You can view system information for each interface in the list by clicking the  button next to its name.
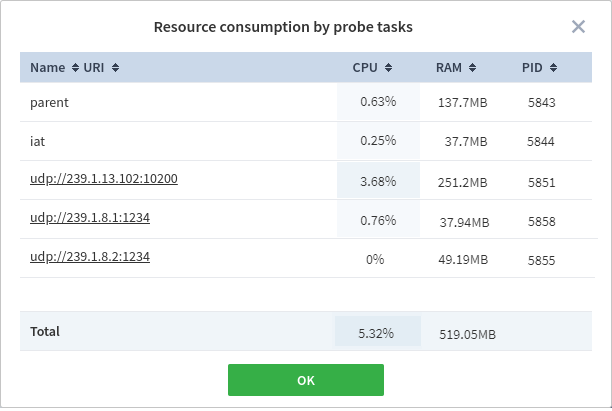
To check how the probe tasks use the system resources, click the show action in the Tasks resources line. The opened window displays CPU and RAM usage for each probe task. In addition, the list will always show two probe system processes: iat and parent.
You can change the monitoring options and clearly see how the task resources change. If you find that a task is consuming a lot of resources (memory leaks and other problems), please contact the technical support: tsup@elecard.com.
Records
To view the records created by the probe, go to the Record list line and click show. The procedure of working with the list of records is described in detail in Working with System ➝ Recording ➝ Recording Lists.