
BlockView
Overview
BlockView represents active analysis tasks as colored blocks. This lets you evaluate the current state of analyzed services in real time. The block color corresponds to the severity level of a registered event. When multiple events that have different severity levels are registered, the block is painted in the color of the most severe event. The view allows all analysed services to be displayed on one screen without scrolling or pagination owing to block sizing and Task consolidation.
Working With the View
In the upper part of the view, there is a penalty area, where blocks with registered issues are moved to. As soon as the issue is resolved, the block returns to green area.
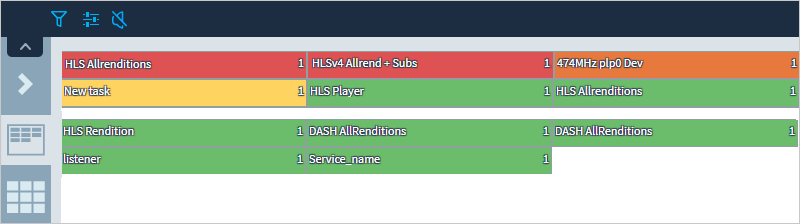
If you hover the mouse over the task name, a hint with the number of registered events will be displayed.
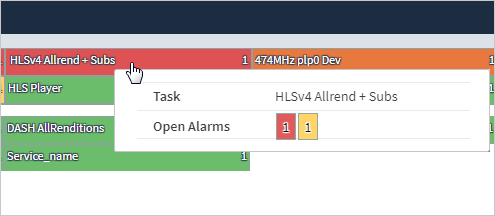
Clicking a block will open the information window for a service/group.
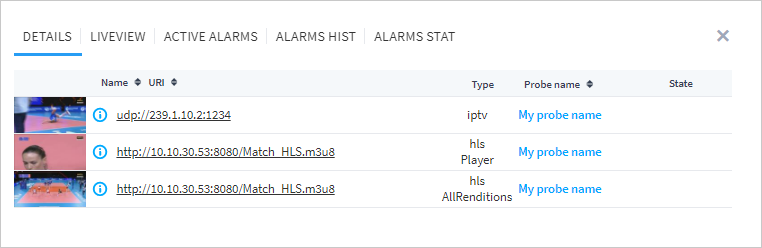
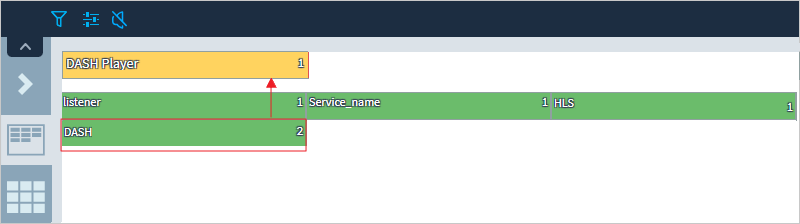
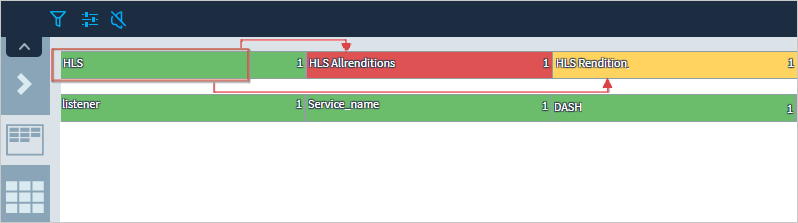
All grouped channels are displayed when opening the Details tab. As shown in the picture, one IPTV and two OTT tasks are grouped, one task analyzes alternative renditions. To go to the required page, click the task or probe name. Flags of the active errors and their number are displayed in the State column.
A channel live graphs are displayed at the Liveview tab (approximate period is 15 minutes). The graphics are stripes marked with errors and events. The graphs are updated every second. For OTT tasks in the all bitrates analysis mode, the total number of errors and events occurred in all bitrates is displayed at the same graph. Hover a cursor over an event or error mark, the event or error name is displayed. Go to the corresponding task page by clicking the graph. See more details on graphs in the LiveView section. On the stream thumbnail, there is the number of priority (TR1, TR2, TR3) for which the error was registered. If errors of several priorities appear, the most severe priority will be specified. For example, if TR1 and TR3 errors are registered for the stream, the thumbnail will display the TR1 priority.
The Active alarms tab displays active problems for the specified group of channels registered in the Alarm journal. Go to the corresponding pages by clicking the task or probe name. To go to the task page with error positioning on a graph (at the time of the event recording), click the time of the event record. Details of an error are displayed in a dialog containing detailed information on the trigger cause.
The Alarms hist tab displays non-active problems for the specified group of channels registered in the Alarm journal within the selected period that can be sorted by a level or a group. Go to the corresponding pages by clicking the task or probe name. To go to the task page with error positioning on a graph (at the time of the event recording), click the time of the event record. Details of an error are displayed in a dialog containing detailed information on the trigger cause.
The Alarms stat tab displays summarized information on the quantity and duration of each priority errors (fired triggers) during the 15-minute and 24-hour interval.
Setting up the View
You can adjust the display of information and mute sound notifications using View Settings for all views.
To change the data representation, use the  button in the left part of the view. You can select the refresh frequency, manage the display order and grouping of analyzed services.
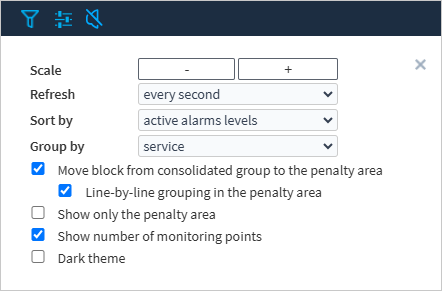
To change the size of blocks, use the Scale button.
By default, the table is refreshed each second. This lets you evaluate the state of services in real time. If necessary, you can change the frequency with which the information is refreshed on the view (1/5/30 sec.). If you disable the page refresh, it will display the state of streams registered at the moment when the page is opened.
The tasks on the view can be sorted in the alphabetical order or by the active alarms severity levels via the Sort by button.
The Group by setting can be used to group tasks or consolidate tasks. Using this setting, you can group tasks by service, URI, name, or probe. If there are issues with streams, the entire group is moved to the penalty area, and the group’s block is painted with the color of the most severe event. You can change the order in which groups move into the penalty area as follows:
If you enable the Move block from consolidated group to the penalty area option, the blocks with issues will be excluded from the group and moved to the penalty area, and the rest of the group remains in the green zone.
If the Line-by-line grouping in the penalty area box is ticked, then when an error is registered on one of the services, the entire group will be moved to the penalty area. In this case, the streams with no errors will be grouped on the left side of the line. Streams with errors leave the group and are placed to the right; they are sorted by the error severity level. When another group has a problem, it is placed on a new line in the penalty area.
When the Show only the penalty area option is enabled, the view will display only the services with errors. Once the error has been resolved, the service will disappear from the penaly area.
The Show number of monitoring points setting enables the display of the number of monitoring points joined in a service (indicated by a number in the lower right corner of the block).
The displayed streams can be sorted by using tags.
To do this, assign a required tag to one or multiple tasks in task settings, click the  button and select the tag from the list.